# Keep the original annotation style; just append recent records and fix dates.
import matplotlib.pyplot as plt
import matplotlib.dates as mdates
import pandas as pd
# ----------------------------
# Original 13 annotated points (unchanged)
# ----------------------------
data_main = {
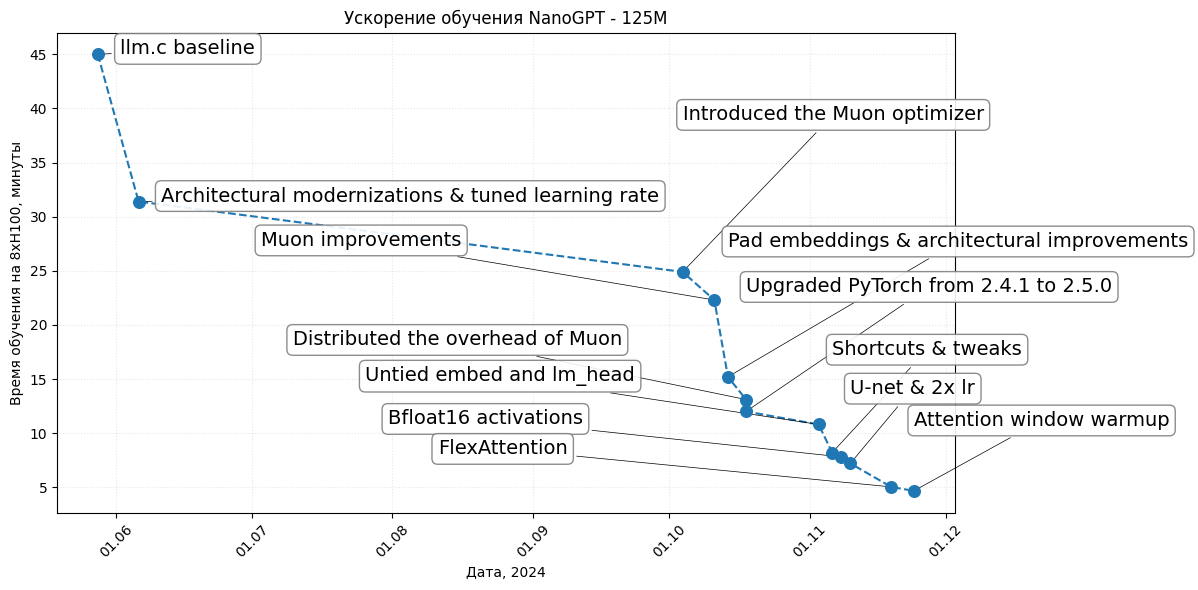
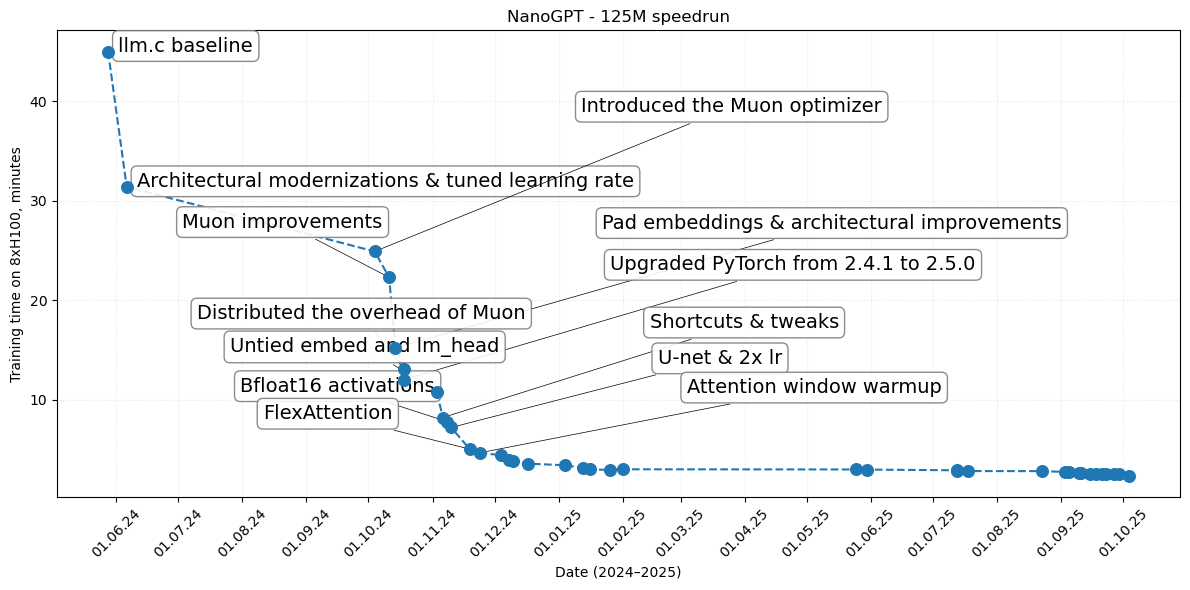
"Record Time (minutes)": [45, 31.4, 24.9, 22.3, 15.2, 13.1, 12.0, 10.8, 8.2, 7.8, 7.2, 5.03, 4.66],
"Description": [
"llm.c baseline",
"Architectural modernizations & tuned learning rate",
"Introduced the Muon optimizer",
"Muon improvements",
"Pad embeddings & architectural improvements",
"Distributed the overhead of Muon",
"Upgraded PyTorch from 2.4.1 to 2.5.0",
"Untied embed and lm_head",
"Shortcuts & tweaks",
"Bfloat16 activations",
"U-net & 2x lr",
"FlexAttention",
"Attention window warmup"
],
"Date": [
"05/28/24", "06/06/24", "10/04/24", "10/11/24", "10/14/24", "10/18/24", "10/18/24",
"11/03/24", "11/06/24", "11/08/24", "11/10/24", "11/19/24", "11/24/24"
]
}
# ----------------------------
# Recent records (unlabeled so the right side stays clean)
# From the repo's world-record table (#14–#35) plus the latest 2:20 on 2025-10-04.
# ----------------------------
recent_records = [
(4.41, "12/04/24"),
(3.95, "12/08/24"),
(3.80, "12/10/24"),
(3.57, "12/17/24"),
(3.40, "01/04/25"),
(3.142, "01/13/25"),
(2.992, "01/16/25"),
(2.933, "01/26/25"),
(2.997, "02/01/25"),
(2.979, "05/25/25"),
(2.966, "05/30/25"),
(2.896, "07/13/25"),
(2.863, "07/13/25"),
(2.817, "07/18/25"),
(2.812, "08/23/25"),
(2.731, "09/03/25"),
(2.717, "09/05/25"),
(2.656, "09/10/25"),
(2.625, "09/11/25"),
(2.565, "09/15/25"),
(2.547, "09/18/25"),
(2.527, "09/21/25"),
(2.495, "09/23/25"),
(2.483, "09/27/25"),
(2.476, "09/29/25"),
(2.345, "10/04/25")
]
# Build dataframe: keep original labels on the first 13, blank labels for new points
df_main = pd.DataFrame(data_main)
df_tail = pd.DataFrame({
"Record Time (minutes)": [t for t, d in recent_records],
"Description": [""] * len(recent_records),
"Date": [d for t, d in recent_records],
})
df = pd.concat([df_main, df_tail], ignore_index=True)
df["Date"] = pd.to_datetime(df["Date"], format="%m/%d/%y")
df = df.sort_values("Date").reset_index(drop=True)
# Prepare data
dates = df["Date"]
times = df["Record Time (minutes)"]
descriptions = df["Description"]
# Plot
plt.figure(figsize=(12, 6))
plt.plot(dates, times, linestyle="--", zorder=-200)
plt.scatter(dates, times, marker="o", s=70, zorder=100)
# --- Original annotation logic for the first 13 points only ---
for i, (date, time, desc) in enumerate(zip(dates, times, descriptions)):
if not desc.strip():
continue # skip labels for new points to avoid clutter
# Same offsets you used originally
if i <= 1:
y_offset = 0
x_offset = pd.Timedelta(days=5)
elif desc == "U-net & 2x lr":
y_offset = 16 if i % 2 == 0 else 7
y_offset = int(y_offset * (1 - i/20)) * 0.8
x_offset = pd.Timedelta(days=100 if i % 2 == 0 else -100)
else:
y_offset = 16 if i % 2 == 0 else 7
y_offset = int(y_offset * (1 - i/20))
x_offset = pd.Timedelta(days=100 if i % 2 == 0 else -100)
plt.annotate(
desc,
xy=(date, time),
xytext=(date + x_offset, time + y_offset),
arrowprops=dict(arrowstyle="-", lw=0.5),
fontsize=14,
bbox=dict(boxstyle="round,pad=0.3", edgecolor="gray", facecolor="white", alpha=0.9, zorder=-100)
)
# Axes formatting (fix MonthLocator typo and broaden label)
plt.title("NanoGPT - 125M speedrun")
plt.xlabel("Date (2024–2025)")
plt.ylabel("Training time on 8xH100, minutes")
ax = plt.gca()
ax.xaxis.set_major_formatter(mdates.DateFormatter("%d.%m.%y"))
ax.xaxis.set_major_locator(mdates.MonthLocator()) # ← fixed
plt.xticks(rotation=45)
plt.grid(alpha=0.3, linestyle=":")
plt.tight_layout()
# Save & show
plt.savefig("nanogpt_speedrun_recent.png", dpi=200)
plt.savefig("nanogpt_speedrun_recent.pdf")
plt.show()